

This post will show you how to install vnstat and vnstati on the EdgeRouter for bandwidth monitoring, as well as how to create a graphical dashboardwith historical bandwidth data.
Installation
Add non-free sources to APT:
EdgeOS 1.X
configure
set system package repository wheezy components 'main contrib non-free'
set system package repository wheezy distribution wheezy
set system package repository wheezy url http://archive.debian.org/debian
commit ; save
sudo apt-get update
EdgeOS 2.X
configure
set system package repository stretch components 'main contrib non-free'
set system package repository stretch distribution stretch
set system package repository stretch url http://http.us.debian.org/debian
commit ; save
sudo apt-get update
Install the packages
sudo apt-get install vnstat vnstati
vnstat configuration
Edit the config file in /etc/vnstat.conf to be like the following. This will make sure your bandwidth data will survive a firmware update. (However, you’ll have to reinstall and reconfigure vnstat / vnstati after a firmware update).
Click to expand your relevant configuration:
EdgeOS 1.X configuration
# vnStat 1.11 config file
##

# default interface
Interface "eth0"

# location of the database directory
DatabaseDir "/var/lib/vnstat"

# locale (LC_ALL) ("-" = use system locale)
Locale "-"

# on which day should months change
MonthRotate 1

# date output formats for -d, -m, -t and -w
# see 'man date' for control codes
DayFormat    "%x"
MonthFormat  "%b '%y"
TopFormat    "%x"

# characters used for visuals
RXCharacter       "%"
TXCharacter       ":"
RXHourCharacter   "r"
TXHourCharacter   "t"

# how units are prefixed when traffic is shown
# 0 = IEC standard prefixes (KiB/MiB/GiB/TiB)
# 1 = old style binary prefixes (KB/MB/GB/TB)
UnitMode 0

# output style
# 0 = minimal & narrow, 1 = bar column visible
# 2 = same as 1 except rate in summary and weekly
# 3 = rate column visible
OutputStyle 3

# used rate unit (0 = bytes, 1 = bits)
RateUnit 1

# maximum bandwidth (Mbit) for all interfaces, 0 = disable feature
# (unless interface specific limit is given)
MaxBandwidth 1000

# interface specific limits
#  example 8Mbit limit for eth0 (remove # to activate):
#MaxBWeth0 8

# how many seconds should sampling for -tr take by default
Sampletime 5

# default query mode
# 0 = normal, 1 = days, 2 = months, 3 = top10
# 4 = dumpdb, 5 = short, 6 = weeks, 7 = hours
QueryMode 0

# filesystem disk space check (1 = enabled, 0 = disabled)
CheckDiskSpace 1

# database file locking (1 = enabled, 0 = disabled)
UseFileLocking 1

# how much the boot time can variate between updates (seconds)
BootVariation 15

# log days without traffic to daily list (1 = enabled, 0 = disabled)
TrafficlessDays 1


# vnstatd
##

# how often (in seconds) interface data is updated
UpdateInterval 30

# how often (in seconds) interface status changes are checked
PollInterval 5

# how often (in minutes) data is saved to file
SaveInterval 60

# how often (in minutes) data is saved when all interface are offline
OfflineSaveInterval 60

# force data save when interface status changes (1 = enabled, 0 = disabled)
SaveOnStatusChange 0

# enable / disable logging (0 = disabled, 1 = logfile, 2 = syslog)
UseLogging 1

# file used for logging if UseLogging is set to 1
LogFile "/var/log/vnstat.log"

# file used as daemon pid / lock file
PidFile "/var/run/vnstat.pid"


# vnstati
##

# title timestamp format
HeaderFormat "%x %H:%M"

# show hours with rate (1 = enabled, 0 = disabled)
HourlyRate 1

# show rate in summary (1 = enabled, 0 = disabled)
SummaryRate 1

# layout of summary (1 = with monthly, 0 = without monthly)
SummaryLayout 1

# transparent background (1 = enabled, 0 = disabled)
TransparentBg 0

# image colors
CBackground     "FFFFFF"
CEdge           "AEAEAE"
CHeader         "606060"
CHeaderTitle    "FFFFFF"
CHeaderDate     "FFFFFF"
CText           "000000"
CLine           "B0B0B0"
CLineL          "-"
CRx             "92CF00"
CTx             "606060"
CRxD            "-"
CTxD            "-"
EdgeOS 2.X configuration
# vnStat 1.15 config file
##

# default interface
Interface "eth0"

# location of the database directory
DatabaseDir "/var/lib/vnstat"

# locale (LC_ALL) ("-" = use system locale)
Locale "-"

# on which day should months change
MonthRotate 1

# date output formats for -d, -m, -t and -w
# see 'man date' for control codes
DayFormat    "%x"
MonthFormat  "%b '%y"
TopFormat    "%x"

# characters used for visuals
RXCharacter       "%"
TXCharacter       ":"
RXHourCharacter   "r"
TXHourCharacter   "t"

# how units are prefixed when traffic is shown
# 0 = IEC standard prefixes (KiB/MiB/GiB/TiB)
# 1 = old style binary prefixes (KB/MB/GB/TB)
UnitMode 0

# output style
# 0 = minimal & narrow, 1 = bar column visible
# 2 = same as 1 except rate in summary and weekly
# 3 = rate column visible
OutputStyle 3

# used rate unit (0 = bytes, 1 = bits)
RateUnit 1

# try to detect interface maximum bandwidth, 0 = disable feature
# MaxBandwidth will be used as fallback value when enabled
BandwidthDetection 1

# maximum bandwidth (Mbit) for all interfaces, 0 = disable feature
# (unless interface specific limit is given)
MaxBandwidth 1000

# interface specific limits
#  example 8Mbit limit for eth0 (remove # to activate):
#MaxBWeth0 8

# how many seconds should sampling for -tr take by default
Sampletime 5

# default query mode
# 0 = normal, 1 = days, 2 = months, 3 = top10
# 4 = exportdb, 5 = short, 6 = weeks, 7 = hours
QueryMode 0

# filesystem disk space check (1 = enabled, 0 = disabled)
CheckDiskSpace 1

# database file locking (1 = enabled, 0 = disabled)
UseFileLocking 1

# how much the boot time can variate between updates (seconds)
BootVariation 15

# log days without traffic to daily list (1 = enabled, 0 = disabled)
TrafficlessDays 1


# vnstatd
##

# switch to given user when started as root (leave empty to disable)
DaemonUser ""

# switch to given user when started as root (leave empty to disable)
DaemonGroup ""

# how often (in seconds) interface data is updated
UpdateInterval 30

# how often (in seconds) interface status changes are checked
PollInterval 5

# how often (in minutes) data is saved to file
SaveInterval 60

# how often (in minutes) data is saved when all interface are offline
OfflineSaveInterval 60

# how often (in minutes) bandwidth detection is redone when
# BandwidthDetection is enabled (0 = disabled)
BandwidthDetectionInterval 5

# force data save when interface status changes (1 = enabled, 0 = disabled)
SaveOnStatusChange 0

# enable / disable logging (0 = disabled, 1 = logfile, 2 = syslog)
UseLogging 2

# create dirs if needed (1 = enabled, 0 = disabled)
CreateDirs 1

# update ownership of files if needed (1 = enabled, 0 = disabled)
UpdateFileOwner 1

# file used for logging if UseLogging is set to 1
#LogFile "/var/log/vnstat/vnstat.log"
LogFile "/var/log/vnstat.log"

# file used as daemon pid / lock file
#PidFile "/var/run/vnstat/vnstat.pid"
PidFile "/var/run/vnstat.pid"

# vnstati
##

# title timestamp format
HeaderFormat "%x %H:%M"

# show hours with rate (1 = enabled, 0 = disabled)
HourlyRate 1

# show rate in summary (1 = enabled, 0 = disabled)
SummaryRate 1

# layout of summary (1 = with monthly, 0 = without monthly)
SummaryLayout 1

# transparent background (1 = enabled, 0 = disabled)
TransparentBg 0

# image colors
CBackground     "FFFFFF"
CEdge           "AEAEAE"
CHeader         "606060"
CHeaderTitle    "FFFFFF"
CHeaderDate     "FFFFFF"
CText           "000000"
CLine           "B0B0B0"
CLineL          "-"
CRx             "92CF00"
CTx             "606060"
CRxD            "-"
CTxD            "-"
Using vnstat
Monthly bandwidth
vnstat -m -i eth0
Daily bandwidth
vnstat -d -i eth0
Live bandwidth usage
vnstat -l -i eth0
Configure vnstati to generate images for bandwidth dashboard
Create the file /var/lib/vnstat/vnstati-update.sh (for example using vi which is included with EdgeOS) with the content:
#!/bin/bash
vnstati -s -i eth0 -o /tmp/vnstat-summary.png
vnstati -h -i eth0 -o /tmp/vnstat-hourly.png
vnstati -m -i eth0 -o /tmp/vnstat-monthly.png
vnstati -d -i eth0 -o /tmp/vnstat-daily.png
Make it executable:
chmod +x /var/lib/vnstat/vnstati-update.sh
Schedule the script to run every hour to keep the images up to date:
crontab -e
Add the line:
0 * * * * /var/lib/vnstat/vnstati-update.sh
Run the script manually once so the first images are generated:
/var/lib/vnstat/vnstati-update.sh
Now it’s time for the last step, symlinking the images generated in the /tmp folder into the webroot of the Web UI. Run:
ln -s /tmp/vnstat-summary.png /var/www/htdocs/media/vnstat-summary.png
ln -s /tmp/vnstat-hourly.png /var/www/htdocs/media/vnstat-hourly.png
ln -s /tmp/vnstat-monthly.png /var/www/htdocs/media/vnstat-monthly.png
ln -s /tmp/vnstat-daily.png /var/www/htdocs/media/vnstat-daily.png
Set up a dashboard
Create the file /var/www/htdocs/media/dashboard.html (For example you can use vi which is included in EdgeOS)
Add the content below. Replace 192.168.10.1 with your router IP.
<!DOCTYPE html>
<html>
<head>
<meta charset="UTF-8">
<title>BW Dashboard</title>
<style>
body {
text-align: center;
}
</style>
</head>
<body>
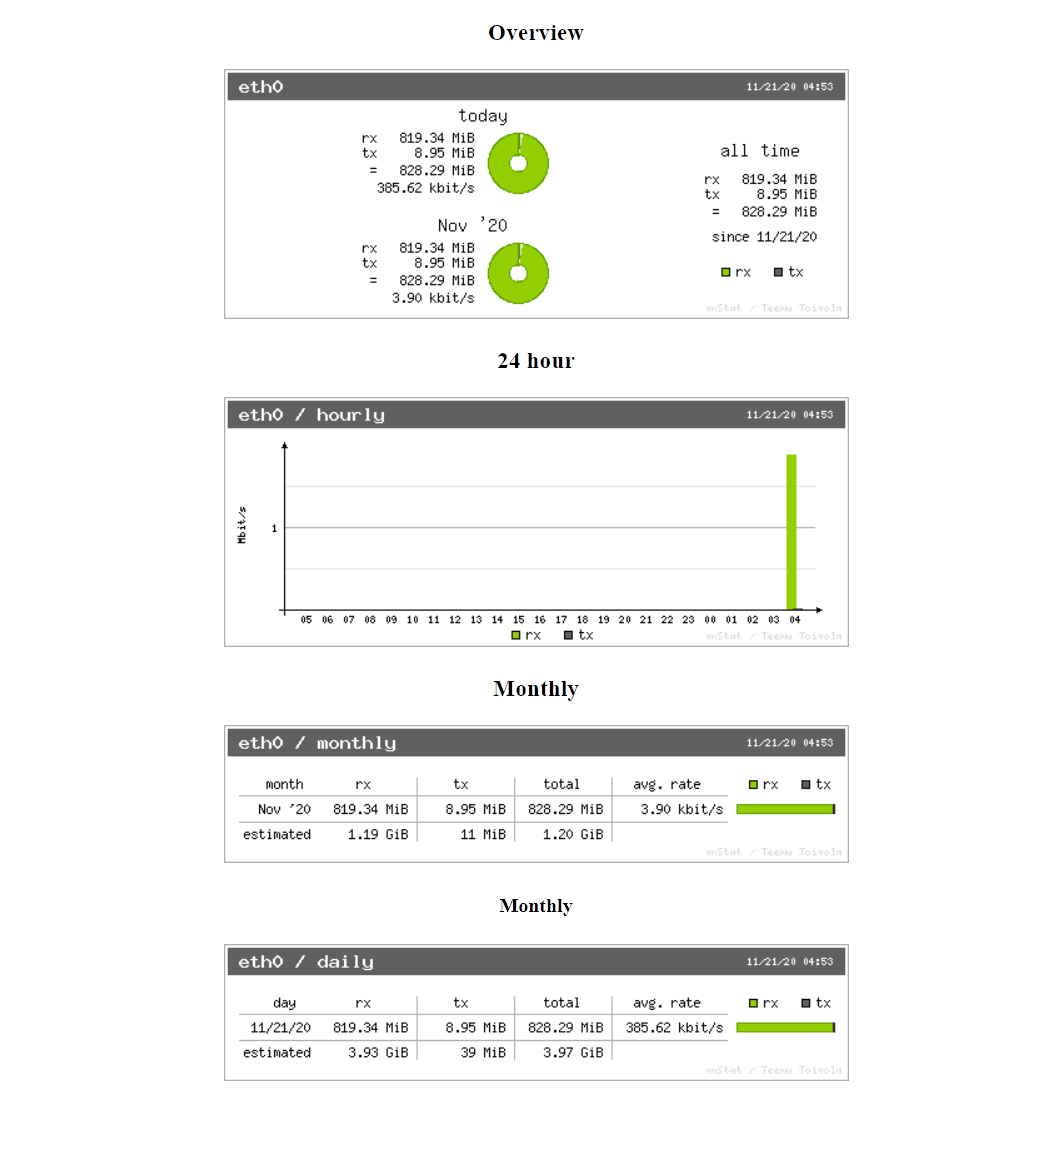
<h3>Overview</h3>
<img src="https://192.168.10.1/media/vnstat-summary.png">
<h3>24 hour</h3>
<img src="https://192.168.10.1/media/vnstat-hourly.png">
<h3>Monthly</h3>
<img src="https://192.168.10.1/media/vnstat-monthly.png">
<h4>Monthly</h4>
<img src="https://192.168.10.1/media/vnstat-daily.png">
</body>
</html>
Now you can visit your dashboard at https://192.168.10.1/media/dashboard.html (replace with your router IP).
Now let’s Marvel at the results!
Cleanup
sudo apt-get clean && sudo apt-get autoclean && sudo apt-get autoremove && rm /var/cache/apt/pkgcache.bin /var/cache/apt/srcpkgcache.bin

 George
 Brian
Brian
 Brian
Brian
 Matt
Matt